
- Description
Description
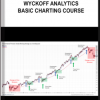
Wyckoff Analytics – Basic Charting Course
Checkout more: Wyckoff Analytics
Sale Page : wyckoffanalytics
This product is available
You can refer to the screenshots here :
Please contact us to get free sample
What will be covered?
This course presents a wealth of foundational chart-reading knowledge, encompassing both Technical Analysis (TA) and the Wyckoff Method. You will learn elemental to intermediate charting principles, including our personal interpretations of conventional (TA) concepts within a Wyckoff Method context. The Basic Course focuses on the essential analytical techniques that will allow you to make a seamless transition from TA to the Wyckoff Method!
How will you benefit from these materials?
This course will provide you with a clear understanding of:
- Fundamental concepts in Technical Analysis (TA)
- Core analytical principles of the Wyckoff Method
- Our perspectives of the key differences and areas of complementarity between conventional TA and the Wyckoff Method
When you complete the Basic Course, you will be well prepared for the next steps on the path to mastery of the Wyckoff Method.
CURRICULUM
- Types of Charts: Vertical (aka Bar), Candlestick, Point & Figure (P&F), Candlevolume
- Descriptions and visual explanations of each type, including appropriate usage contexts and benefits
- Vertical bar (+ volume bars) – Tape Reading
- Point-and-Figure – companion to vertical charts, horizontal counts, less price volatility (not time), tape reading, volume
- Candlestick – Basic structure + visualizations
- Candlevolume charts – Combining candlestick + volume
- Descriptions and visual explanations of each type, including appropriate usage contexts and benefits
- Time Frames: intraday, daily, weekly, monthly
- Traditional timeframes and how they are best used. Campaigns (weekly + monthly), swing (daily), intraday (intraday + daily)
- Combining multiple timeframes
- Price and volume patterns are fractal on different time frames
- The Market as a Discounting Mechanism and a visual representation of campaigns actions conducted by the Composite Operator (CO)
- Technical Analysis reveals the Discounting Mechanism. Definition. Long-term trend initiation, with catalyst(s) appearing later on.
- The Composite Operator as a heuristic for institutional participation
- Cyclicality vs the Price Cycle
- Technical Analysis Cyclicality. 3-5 year business cycle
- Business cycle corresponds with the market cycle
- Wyckoff Price Cycle: Accumulation, Mark-up, Distribution, Mark-down
- Trends and trading ranges within Price Cycle
- Price Cycle sequence: Accumulation, Mark-up, Re-accumulation, Mark-up, Distribution, Mark-down, Re-distribution
- Cyclicality of Price inside the channel
- Different time frames’ cyclicality and the Price Cycle
- Trading Range: Support/Resistance, Breakouts, Failed Breakouts, Upthrusts (UT) and Springs/Shakeouts(SO) or Signs of Strength (SOS)/Signs of Weakness(SOW)
- Technical Analysis: Trading ranges explained
- Technical Analysis: Support and resistance defined
- Technical Analysis: Breakouts and failed breakouts
- Wyckoff: Support and resistance defined
- Wyckoff: UT and Spring/SO as failed breakouts + SOS/SOW as successful breakouts
- Trends: Definition – Higher Highs(HH)/Higher Lows (HL). Logarithmic vs arithmetic scales. Moving averages (MA), Linear Regression Line (LRL)
- Technical Analysis: Trend Definition. HH/HL for uptrends and the reverse for downtrends
- Comparison of logarithmic vs arithmetic scaling
- Technical Analysis: Trend defined by TA tools (MA, Linear Regression Line)
- Wyckoff: Also HH/HL
- Trends: Conventional and Reverse Trendlines. Break of trendlines/Change of Character (ChoCh)
- Throw-overs and Oversold/Overbought conditions
- Break of Trendline signal. TA vs Wyckoff CHoCH
- Visuals: Multiple examples
- Price formations: Technical Analysis Patterns
- Reversal vs continuation patterns
- Trading ranges, including triangles, flags and pennants, wedges
- Triangles of different kinds compared with Wyckoff’s Hinge or Apex
- Head & Shoulders, inverse patterns, double tops and bottoms,
- Parabolic, V-formations or spikes
- Rounding top/bottom formations
- Wyckoff Price Formations: Accumulation
- Accumulation Events: Selling climaxes, secondary tests, springs, and others
- Accumulation Phases. Predictable sequences of Accumulation events
- Wyckoff Price Formations: Distribution
- Distribution Events. Buying climaxes, secondary tests, UTs, and others
- Distribution Phases. Predictable sequences of Distribution events
- Basic Technical Analysis definitions
- Volume leads price.
- Volume confirmation of price, with examples. Volume as evidence of Demand or Supply (or both).
- Volume divergence from price (non-confirmation), with examples.
- Wyckoff Laws: Supply and Demand
- Wyckoff’s Law of Supply and Demand drives the Price Cycle. Example: Exhaustion of Supply in a trading range leads to an uptrend.
- Case study: Price Cycle resulting from changes in Supply and Demand
- Wyckoff Laws: Effort vs. Result
- Effort vs. Results law. Definition.
- Result in line with Effort
- Non-confirmation. Result not in line with Effort.
- Wyckoff Comparative analysis
- Original Wyckoff Course comparative visuals
- Basic construction and interpretation
- Significant highs and lows + slope
- Issues with comparative analysis
- Relative Strength (RS) analysis
- Definition and basic construction
- Basic interpretation
- Heat Map ranking based on changes in RS
- Technical Analysis Indicators useful to Wyckoff Traders. Rate of Change (ROC), Relative Strength Index, Stochastics, and On Balance Volume (OBV)
- Volume: OBV
- Momentum: ROC
- Basic Technical Analysis P&F concepts (vertical measurements)
- One of the oldest charting methods
- P&F breakout patterns
- Vertical price objectives
- Wyckoff P&F Basics (horizontal counts)
- Wyckoff’s Law of Cause and Effect
- Basic horizontal counting guidelines to determine price targets
- 1-box (swing) vs 3-box reversal (campaign)
- Intraday P&F counts examples
- What’s next? Complimenta ry Wyckoff Trading Course 1st session + Wyckoff Market Discussion
Get Wyckoff Analytics – Basic Charting Course on bookoftrader.com
Wyckoff Analytics, Basic Charting Course, Download Basic Charting Course, Free Basic Charting Course, Basic Charting Course Torrent, Basic Charting Course Review, Basic Charting Course Groupbuy.